
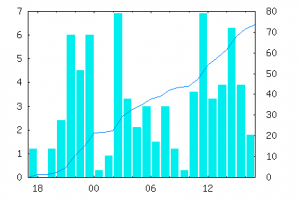
Generated Rain Chart (mm over time)
In the previous blog entry, I have set up my weather station with pywws. In this part, I will show how to create custom reports.
I assume the following directory structure:
- ~/weather/templates stores our text templates.
- ~/weather/graph_templates stores our graph templates.
- /var/www/weather/data contains the directory where we will store temporary reports.
Creating Custom Weather Reports
In the following, we will create a simple 24 hour report. This will give you a good start for creating more complex reports later-on. The commands we use for generating reports, are as follows:
$ python -m pywws.Plot ~/weather/data/ ~/weather/tmp/ ~/weather/graph_templates/24h_temp.png.xml /var/www/weather/data/24h_temp.png
$ python -m pywws.Template ~/weather/data/ ~/weather/templates/24h.html /var/www/weather/data/24h.html
The first command takes a graph template and creates a corresponding graph. The tmp directory is used for generating a temporary gnuplot file which is used for, surprise, running gnuplot. The last argument is the filename of the graph to be generated.
The second command takes a template and generates the corresponding report. No temporary files are necessary for this command. Just the filename of the report as the last command line argument.
These commands are only necessary if you want to generate a graph or report right away. If you list them in the ini file, pywws will automatically pick them up at the appropriate times and generate them. If you are running pywws as daemon and want to force it to generate the reports right away to change the entire setup including the ini file, you should stop pywws and invoke the hourly pywws command as follows.
$ pywws-livelog-daemon -v ~/weather/data ~/weather/data/pywws.log stop
$ pywws-hourly -vvvv ~/weather/data
$ pywws-livelog-daemon -v ~/weather/data ~/weather/data/pywws.log start
Note, that you should not run pywws as daemon and in the hourly/cron form at the same time.
Graph Templates
I will show you two graph templates that I have generated and discuss them. These templates are heavily based on the examples distributed as part of pywws. However, I have one or another nugget in here that is not present in the original examples.
<graph>
<size>432, 288</size>
<duration>hours=24</duration>
<xtics>6</xtics>
<xlabel></xlabel>
<xformat>%H</xformat>
<dateformat></dateformat>
<plot>
<title></title>
<yrange>0, 20<*</yrange>
<source>raw</source>
<subplot>
<style>+ 1</style>
<colour>4</colour>
<ycalc>(None, wind_kmph(data['wind_gust']))[data['wind_gust'] > wind_kmph(data['wind_ave'])]</ycalc>
<title>gust</title>
</subplot>
<subplot>
<colour>3</colour>
<ycalc>wind_kmph(data['wind_ave'])</ycalc>
<title>average</title>
</subplot>
</plot>
</graph>
The tags above are mostly self explanatory and I will only discuss some of them. The size is given as (width, height). The duration by default assumes the last n time units until now. A start or stop time can be specified as well.
The graph may contain multiple plot sections although the example above only uses a single one. The source entry specifies the data source to use for the plot. It may be raw for the unprocessed data and hourly, daily, and monthly for the respective accumulation periods. Notw that within one plot, unfortunately, one cannot mix multiple data sources. One workaround to this could be to export the data as report (template, see below) and subsequently process it with a custom script.
The yrange may take any specifier that is allowed by gnuplot. One thing missing in the pywws specification and templates is that you can specify for the bounds upper and lower limits. For instance, 0, 20<*<100 would specify a fixed lower bound of 0 and an upper bound that is to be scaled by gnuplot in the range between 20 and 100 depending on the data. However, remember to escape the < inside the xml document.
A plot itself, may have multiple subplots. For any of these, we may specify the title (left blank in plot because I prefer it as part of the page that includes the graph).
Within ycalc tag, you specify the data to be printed. This may be any valid python expression. pywws also provides a set of functions to convert the weather data into the units of your choice. For a list of functions have a look here.
Plots can be shown in different forms which is specified with the style tag. In this example, the wind speed is shown as a continuous lines and the gust speed as scatter plot.
In this example, you may want to note the calculation used for the gust subplot. We create a tuple of none and the actual value and select among the two based on whether the gust speed is above the average speed (otherwise, there is no point in showing it).
<plot>
<title></title>
<yrange>0, 4<*</yrange>
<y2range>0, 20<*</y2range>
<source>hourly</source>
<subplot>
<title></title>
<colour>5</colour>
<style>box</style>
<xcalc>data['idx'].replace(minute=30, second=0)</xcalc>
<ycalc>data['rain']</ycalc>
</subplot>
<subplot>
<title></title>
<colour>3</colour>
<axes>x1y2</axes>
<ycalc>data['rain'] + last_ycalc</ycalc>
</subplot>
</plot>
For the second example, I am only showing the corresponding plot entry. This one is based on the hourly data. The interesting items here are that the rain is shown as a bar chart indicating the rain that has fallen in the respective hour. Additionally, we use the xscale to nicely display the box within the hour.
Additionally, we show the accumulated rain fall that occurred within the last 24 hours. This is accomplished with the special variable last_ycalc which stores the value of the previous data computation for the plot.
Templates
For the specification of templates, I do not have much to add what is shown in the examples and what is documented as part of the Template module.
Uploading Weather Data
We also want to upload our new reports to a remote web site with sftp. If you plan do not plan to use sftp but prefer to use plain ftp, you do not need to install any dependencies. For this, we need to install pycrypto and paramiko. pycrypto wants to compile a program and link it to python which is why we need the Python-dev library as well.
$ sudo apt-get install python-dev
Now, we can install pycrypto and paramiko with pip as follows:
$ sudo pip install pycrypto paramiko
Next, we need to adapt our weather.ini file and update the [ftp] section as follows:
[ftp]
local site = False
secure = True
site = $your-sites-hostname
user = $your-sites-username
password = $your-sites-password
directory = /
port = 22
Per default, sftp listens on port 22, plain ftp on port 21. Depending on how you have set up your web site, you may want to change the destination directory as well. Also remember that after changing the configuration file, you do have to restart pywws if you run it as daemon.
$ pywws-livelog-daemon -v ~/weather/data ~/weather/data/pywws.log stop
$ pywws-livelog-daemon -v ~/weather/data ~/weather/data/pywws.log start